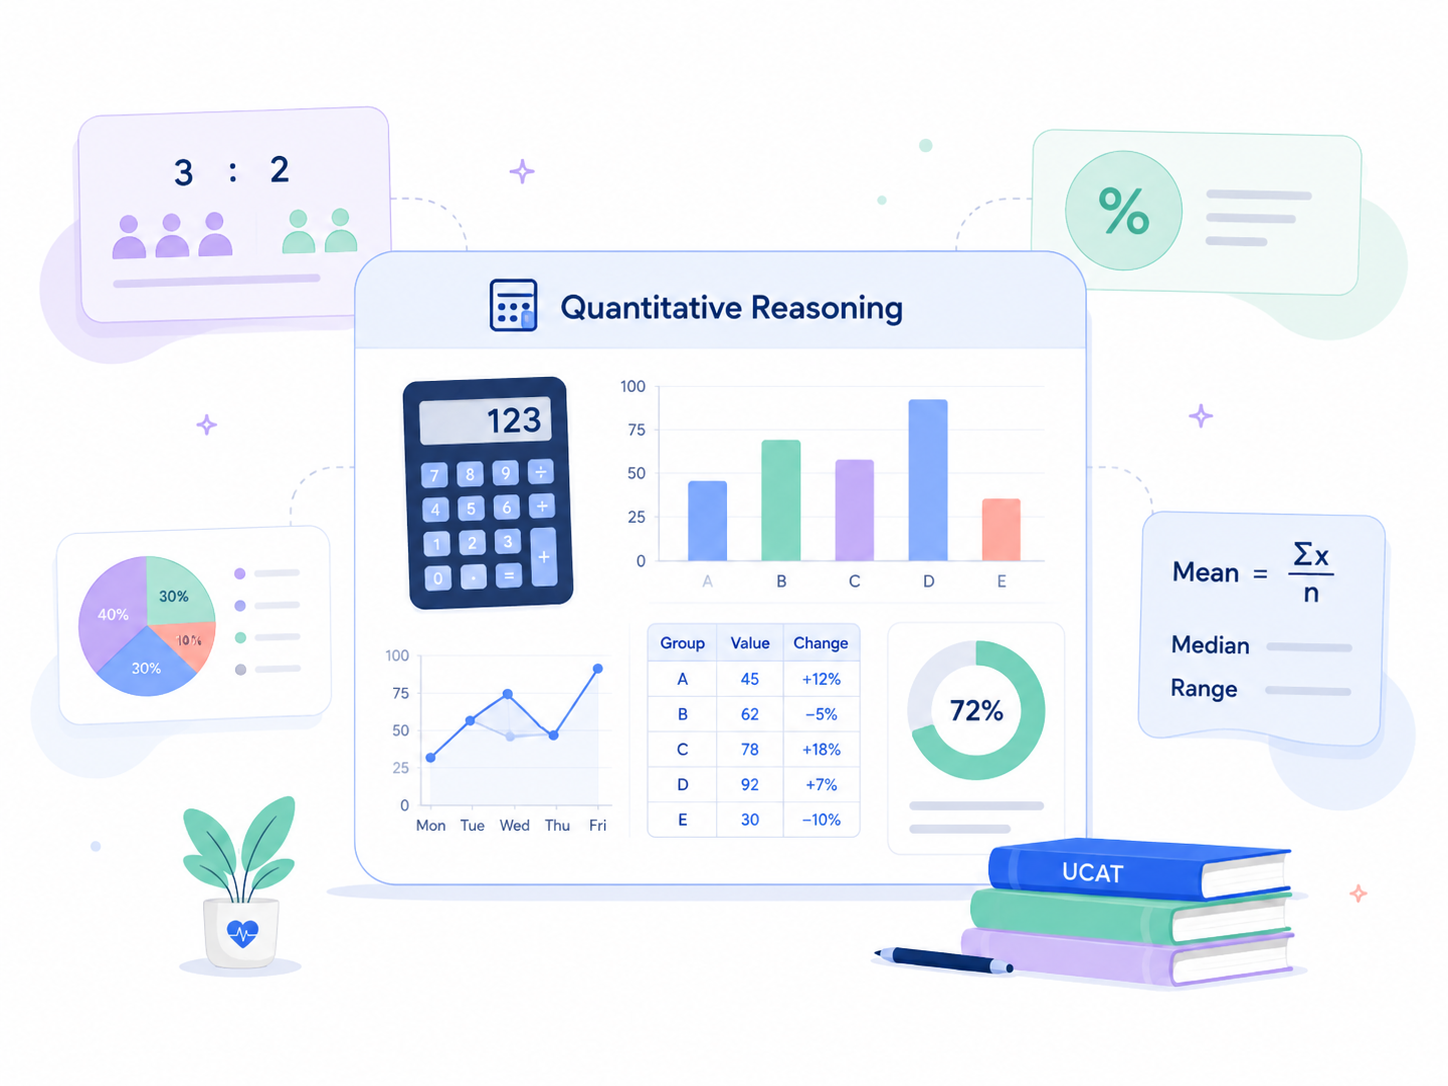
Many QR questions look difficult because the data display is large, not because the maths is hard.
A table may contain twenty numbers when you only need two.
The first step is to read the question before trying to understand every detail in the chart.
Ask: what am I actually looking for?
Then identify the correct row, column, category, year or unit.
Units are especially important. A graph might show values in thousands, millions, percentages or minutes. Missing the unit can give you a completely wrong answer even if your arithmetic is perfect.
You should also watch the axes. Not every graph starts at zero. A small visual difference can look dramatic if the axis is compressed.
When reading line graphs, identify the correct line before comparing values. In grouped bar charts, make sure you are using the correct colour or category.
For tables, use your finger or cursor visually to track across the right row and down the right column. This sounds basic, but it reduces a lot of careless mistakes.
Do not stare at the entire chart hoping the answer will appear. Use the question to guide your search.
Data interpretation gets faster when you stop treating the display as one giant object and start treating it as a map.
Find the location. Read the value. Then calculate.